This Business Analytics lecture tackles Random Sampling. The data Random Accounts Receivable IN PESO.xlsx is available at https://github.com/alcadelina/business-analytics-excel-data.
We want to choose a random size of 25 and do it 25 random
sample times in the 280 accounts.
How can this be possible? And how do we calculate the
average amount owed in each random sample and create the histogram using Tableau.
Objective: Demonstrate how sample means are distributed.
Excel Solution:
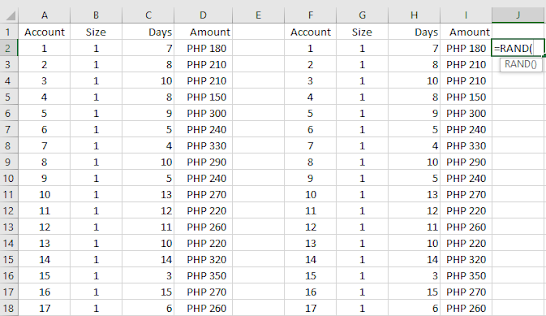
Step 1. Random numbers next to a copy. Copy the original data to columns F.G.H.I.
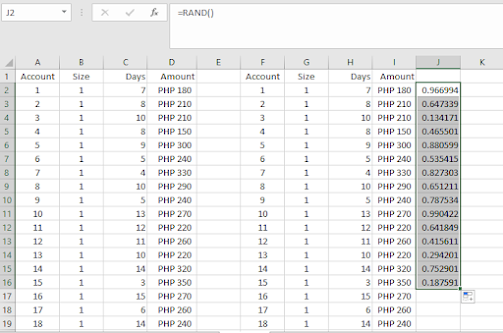
Then enter the formula: =RAND() in cell J1 and copy it down column J.
Step 2. Replace with values. To enable sorting, you
must first “freeze” the random numbers ----that is replace their formulas with
values. To do this, copy the range J1:J280 and select Paste values from the Paste
dropdown menu on the Home Ribbon.
Step 3. Sort. Sort on Column J in ASCENDING ORDER. Then the 25 smallest random numbers are the ones in the sample.
Step 4. Repeat Steps 2 and 3, 25 TIMES. Copy the values in Cell I in a new worksheet.
Step 5. Make
a Table similar below. Use the Average Cost for Histogram.
Step 6. Then
do the Histogram Using Tableau.
Step 7. Create Annotation for your Insights.


No comments:
Post a Comment