Monday, March 14, 2022

EXCEL: Calculating Customer Churn and Average Customer Lifetime Value

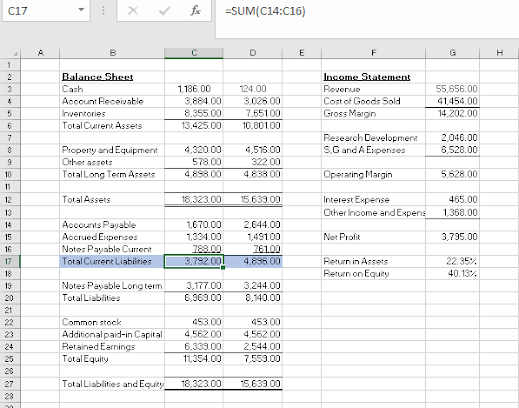
 Customer churn is the measure of how many customers you lose in a given period. It’s an important metric in subscription-based businesses, although it’s applicable to other revenue models as well. If your growth rate (the rate at which you are adding new customers) is higher than your churn rate, then your customer base is growing. If not, you’re losing customers faster than you can add them, and something needs to change.

Figure below shows a churn calculation for a company with recurring monthly revenue. You need to know the number of customers at the beginning and end of the month and the number of new customers in that month.

Subscribers Lost

=C2+C3-C4


Churn Rate

=C6/C2


To determine the number of customers lost during the month, the number of new customers is added to the number of customers at the beginning of the month. Next, the number of customers at the end of the month is subtracted from that total. Finally, the number of customers lost during the month is divided by the number of customers at the beginning of the month to get the churn rate.
In this example, the business has a churn rate of 9.21%. It is adding more customers than it is losing, so that churn rate may not be seen as a problem. However, if the churn rate is higher than expected, the company may want to investigate why it’s losing customers and change its pricing, product features, or some other aspect of its business.

EXCEL : Calculating annual churn rate

If a business has monthly recurring revenue, it means that customers sign up and pay for one month at a time. For those companies, it makes sense to calculate the churn rate on a monthly basis. Any new customers during the month will not churn in the same month because they’ve already paid for the month.
A typical magazine, however, signs up subscribers for an annual subscription. A meaningful churn rate calculation for them would be an annual churn rate. If a business wants to calculate a churn rate for a longer period than its recurring revenue model, such as calculating an annual churn for a business with monthly subscribers, the formula changes slightly.

Figure below shows an annual churn rate calculation.
Annual churn rate: =C6/AVERAGE(C2,C4)


The number of lost subscribers is divided by the average of beginning and ending subscribers. Because the period of the churn rate is different than the period of the recurring revenue, some of those 614 new subscribers canceled their subscriptions within the year, albeit in a later month than they first subscribed.


EXCEL: Calculating average customer lifetime value

Customer lifetime value (CLV) is a calculation that estimates the gross margin contributed by
one customer over that customer’s life. The churn rate calculated in Figure 15.7 is a component
of CLV.
Figure 15.9 shows a calculation of CLV using the churn rate previously calculated. The first
step is to calculate the average gross margin per customer.

Gross Margin
=F2-F3


Average Customer Margin
=F4/AVERAGE(C2,C4)


Customer Lifetime Value
=F6/C7


To calculate CLV, follow these steps:
1. Calculate the gross margin.
2. Calculate the average customer margin by dividing the gross margin by the
average number of customers for the month. Because the gross margin was
earned over the month, you have to divide by the average number of customers
instead of either the beginning or ending customer count.
3. Calculate the CLV by dividing the average customer margin by the churn rate.
In this example, each customer will contribute an estimated P828.97 over their lifetime.

Sunday, March 13, 2022

EXCEL: Calculating ROA and ROE

 Calculating return on assets

Return on assets (ROA) is a measure of how efficiently a business is using its assets to generate income. For example, a company with a higher ROA can generate the same profit as one with a lower ROA using fewer or cheaper assets.


Step 1. 


Step 2.


Step 3.


Step 4.


Step 5.


Step 6


Step 7.


Step 8. 


Step 9. 


Step 10. 

To compute ROA, divide the profits for a period of time by the average of the beginning and ending total assets. Figure 15.5 shows a simple balance sheet and income statement and the resulting ROA.

=G15/AVERAGE(C12:D12)


The numerator is simply the net profit from the income statement. The denominator uses the AVERAGE function to find the average total assets for the period.


Calculating return on equity

Another common profitability measure is return on equity (ROE). An investor may use ROE
to determine whether their investment in the business is being put to good use. Like ROA,
ROE divides net profit by the average of a balance sheet item over the same period. ROE,
however, uses average total equity rather than average total assets. 


The formula to calculate
ROE from Figure 15.5 is as follows:
=G15/AVERAGE(C25:D25)

Now you know how to compute ROA and ROE using Excel.


EXCEL: Calculating cost of goods sold

Cost of goods sold is the amount you paid for all the goods you sold. It is a critical component to calculating gross. If you use a perpetual inventory system, you calculate the cost of goods sold for every sale made. For simpler systems, however, you can calculate it based on a physical inventory at the end of the accounting period.


Figure below shows how to calculate the cost of goods sold with only the beginning and ending inventory counts and the total of all of the inventory purchased in the period.
Goods Available for Sale
=SUM(C2:C3)


Cost of Goods Sold
=C4-C5


The goods available for sale is the beginning inventory plus all of the purchases made. It is an intermediate calculation that shows what your ending inventory would be if you didn’t sell anything. 

The cost of goods sold calculation simply subtracts the ending inventory from the goods available for sale. If you had the goods at the start of the period or you bought them during the period but you don’t have them at the end of the period, then they must have been sold.

Now you know how to compute Cost of Goods Sold using Excel.

Friday, March 11, 2022

EXCEL: Calculating EBIT and EBITDA

Earnings before interest and taxes (EBIT) and earnings before interest, taxes, depreciation, and amortization (EBITDA) are common calculations for evaluating the results of a business.

Earnings before interest and taxes (EBIT) is a company's net income before income tax expense and interest expense have been deducted. EBIT is used to analyze the performance of a company's core operations without tax expenses and the costs of the capital structure influencing profit.

While EBITDA or earnings before interest, taxes, depreciation, and amortization is another widely used indicator to measure a company's financial performance and project earnings potential. EBITDA excludes taxes and interest expense on debt as well as depreciation and amortization expenses. As a result, EBITDA reflects the profitability of a company's operational performance before deductions for capital assets, interest, and taxes.

Both are computed by adding back certain expenses to earnings, also known as net profit.


Figure below shows an income statement and the results of the EBIT and EBITDA calculations below it.

Earnings before interest and taxes EBIT

=C18+VLOOKUP("Interest Expense",$B$2:$C$18,2,FALSE)+VLOOKUP("Income

Tax Expense",$B$2:$C$18,2,FALSE)

Earnings before interest, taxes, depreciation, and amortization EBITDA

=C20+VLOOKUP("Depreciation Expense",$B$2:$C$18,2,FALSE)+VLOOKUP

("Amortization Expense",$B$2:$C$18,2,FALSE)

Step 1. Compute the Gross Margin

Step 2. Compute the Total Operating Expenses


Step 3. Compute the Operating Income.


Step 4. Compute the Income (Loss)


Step 5. Compute Earnings before interest and taxes EBIT

=C18+VLOOKUP("Interest Expense",$B$2:$C$18,2,FALSE)+VLOOKUP("Income

Tax Expense",$B$2:$C$18,2,FALSE)


The EBIT formula starts with net loss in C18 and uses two VLOOKUP functions to find the interest expense and income tax expense from the income statement. 

Step 6. Compute the Earnings before interest, taxes, depreciation, and amortization EBITDA

=C20+VLOOKUP("Depreciation Expense",$B$2:$C$18,2,FALSE)+VLOOKUP

("Amortization Expense",$B$2:$C$18,2,FALSE)


For EBITDA, the formula starts with the result of the EBIT calculation and uses the same VLOOKUP technique to add back the depreciation expense and amortization expense.

There is a benefit to using VLOOKUP rather than simply using the cell references to those expenses. 

If the lines on the income statement are moved around, the EBIT and EBITDA formulas won’t need to be changed.

You now know how to compute the EBIT and EBITDA using Excel.
Happy Financial Modelling everybody!


Wednesday, March 9, 2022

EXCEL: Calculating Markup

 Markup is often confused with gross margin percent, but they are different. Markup is the percentage added to costs to arrive at a selling price. Figure below shows the sale of 3 product, the markup applied, and the gross margin realized when sold.


The markup is computed by dividing the selling price by the cost and subtracting 1.
=(C3/C2)-1

By marking up the cost of the car cover 16%, you achieve a 13% gross margin, for car matting the mark up is 43% resulting to gross margin of 43% while the car dash cam with a mark up of 25% will give a gross margin of 25%. 

If you want to increase your Gross Margin % of any product just adjust the selling price. 

Using this formula, you now know how will you sell your product or service with Mark up and gross margin in mind. 

Excel solution can be found at https://github.com/alcadelina/mark-up


EXCEL: Calculating gross profit margin and gross profit margin percent

 Gross margin is the money left over after subtracting the cost of goods sold from the revenue. It’s the amount of sales that the business uses to cover overhead and other indirect costs. To compute the gross margin, simply subtract the cost of goods sold from the revenue. For gross margin percent, divide the gross margin by revenue. 

Figure below shows the financial statement. 


Gross margin is shown in cell C5, and gross margin percent is shown in cell D5.
Gross Margin: =C3-C4

Gross Margin Percent: =C5/$C$3


The gross margin formula simply subtracts cell C4 from cell C3. The gross margin percent divides C5 by C3, but note that the C3 reference is absolute because it has dollar signs. This allows you to copy the formula to other lines on the income statement to see the percentage of revenue, a common analysis performed on income statements.

Excel Solution can be found in https://github.com/alcadelina/Excel-Gross-Margin


Monday, March 7, 2022

EXCEL: Calculating Break Even

 In doing Feasibility Study and in an actual business operation , there is a need to determine how much revenue it will need to achieve a net profit of exactly Php 0. This is called break even. 

The business will estimate its fixed expenses and estimate the percentage of each of its variable expenses. Using those numbers, it can back into a revenue amount that will result in the break even.

The Figure below shows a break-even calculation. 


Column C shows fixed expense.

Step 1. Enter 0 into cell D18 to indicate zero net profit.


Step 2. Enter the fixed expense amounts in column D next to their labels in column B.


Step 3. Enter the percentage the company pays in commission in cell C7 (8%).


Step 4. Enter a percentage equal to 1 minus the expected gross margin in cell C4. In
this example, the company expects a 60% gross margin percent, so 40% is entered
in C4.

Formula for Gross margin:  Gross Margin =SUM(D7:D8)


Step 5. In cell D13, enter the formula for the operating margin :
Operating Margin =SUM(D15:D18)
The operating margin must be the sum of interest expense and other income and expense.
If we estimate the interest expense to be P465 and the other income and expense to be P1,368, then the operating margin must be P1,833 for the net profit to be zero.


Step 6. In cell D8, enter the formula for the margin net of variable expenses:
Margin Net of Variable Expenses =SUM(D10:D13)
This calculation is operating margin plus the fixed operating expenses. It will drive the revenue calculation.


Step 7. In cell D7, enter the formula for selling expenses:
Selling Expenses =ROUND(D3*C7,0)

We haven’t entered the revenue formula yet, so this will be initially zero for now. But once revenue is
entered, it will show the correct value.


Step 8. Enter the formula for cost of goods sold in cell D4
Cost of Goods Sold =ROUND(D3*C4,0)

Like the selling expenses formula, this will return zero until revenue is computed.


Step 9. Finally, enter the formula for revenue in cell D3. 
Revenue =ROUND(D8/(1-SUM(C4:C7)),0)

The revenue calculation divides the margin net of variable expenses by 1 minus the sum of the variable percentages. In the Figure the two variable expenses will be 48% (40% plus 8%) of revenue. One minus that number, 52%, is divided into the margin net of variable expenses to get the revenue.


If this company makes a 60% gross margin, pays 8% in commissions, and has estimated the
fixed expenses accurately, it will need to sell P16,935 to break even.

Best wishes!


EXCEL: Calculating employee turnover

 When an employee decides to end their employment, the company's turnover rate increases. In Finance, it means the employer need to look into their turnover figures to decide when to look for more candidates to replace those who have resigned. In Operational and Logistics Management Employee turnover is treated as a measure of how well an organization is hiring and retaining talent.

A high turnover rate indicates that the organization is not hiring the right people or not retaining people and commonly include both voluntary and involuntary terminations.

Calculating employee turnover then will help the company's decision makers in identifying how to improve employee satisfaction and retention. 

In this blog, I will teach how you will use Excel in Calculating employee Turnover.

In the Figure below shows the employment changes of an organization over a 12-month period. New hires are added to and separations are subtracted from the number of employees at the beginning of the month to get the ending employee count.

Step 1. Get the ending number of employees. See the formula in the figure below.


Step 2. Get the Average Monthly employment. =AVERAGE(F3:F14)


Step 3. Get the Number of Separations. =SUM(E3:E14)


Step 4. Compute the Employee Turnover. =F17/F16


Step 5. Convert the decimal into %. 


Employee turnover is simply the ratio of separations to average monthly employment.
The AVERAGE function is used to calculate the average ending count of employees over
the months. Separations are summed using SUM and are divided by the average monthly
employments.
The result can be compared to historical employee turnover or to industry averages or to companies in the same industry.
Best wishes!