by: Arnel Lopez Cadelina
Tableau Online Site Administrator
It is now time to create your first chart in Tableau. I will make it simple as possible for you to create quickly and at the same time enjoy your journey. We will use the Global Superstore data set provided by Tableau Software. It is free when you downloaded your Tableau Public. Students of mine enjoy using the Global Superstore data set due to me being a Tableau Online Site Administrator.
Here's the step-by step:
1) Load a data file
The first step is to connect to the data you want to explore or visualize. Launch Tableau Public.
a. Connecting to a data file
• Loading a local Excel file.
1) On the left hand side blue navigation area, Connect
a. To a File
b. Excel -> , locate the globalsuperstore.xls file
2) Or File -> Open, locate the .xls file you want to open.
2) Verify the automatically assigned data type
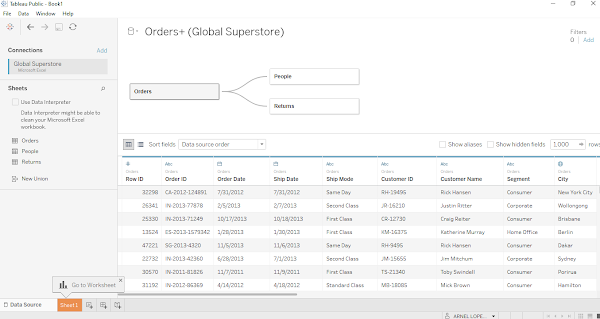
After the data is connected, the column headers from your data source are shown as fields. Tableau assigns each field a data type.
Note: Tableau is only referencing the source data. When you work the data within Tableau, your underlying data won’t be affected. Your original source data remains intact.
3) Click Sheet 1 at the left bottom next to Data Source
4) After the data is loaded, the column headers from your data source are shown as fields on the left side in the Data pane.
5) Tableau puts each field into Dimensions or Measures. Here's how your Tableau screen look like:
6) Drag Year to Columns and Sales to the view area, you will see a numbers in the view. When we drop a field on the Drop field here grid, we are creating a view from a tabular perspective.
7) What Tableau does here is to add the Number of Charges in the table. The default aggregation applied is Sum.
8) Now we have broken down our single number into five numbers. Basically we have sliced the aggregated number by year. When we add a dimension to the view, members of that dimension will be added as column or row headers.
9)If we would rather have row headers, we can drag the YEAR pill to Rows. Drag YEAR pill back to the Columns shelf. 10) If we would like to put Order Date, we drag it to the Rows shelf. Now we see we have further broken down the three numbers. We got a table of 4 rows and 6 columns.
11) At any time, you can right click over a number and choose View Data… to view the underlying sliced data.
12) Right click over Sheet 1 and rename it to My First DataViz.
Congratulations, you created your first data viz.
Welcome to the Tableau Family.
Arnel Lopez Cadelina, MBA, RREA, CFA(Investment Foundation)
Tableau Online Site Administrator
Next blog: Understanding SHOW ME Menu


No comments:
Post a Comment